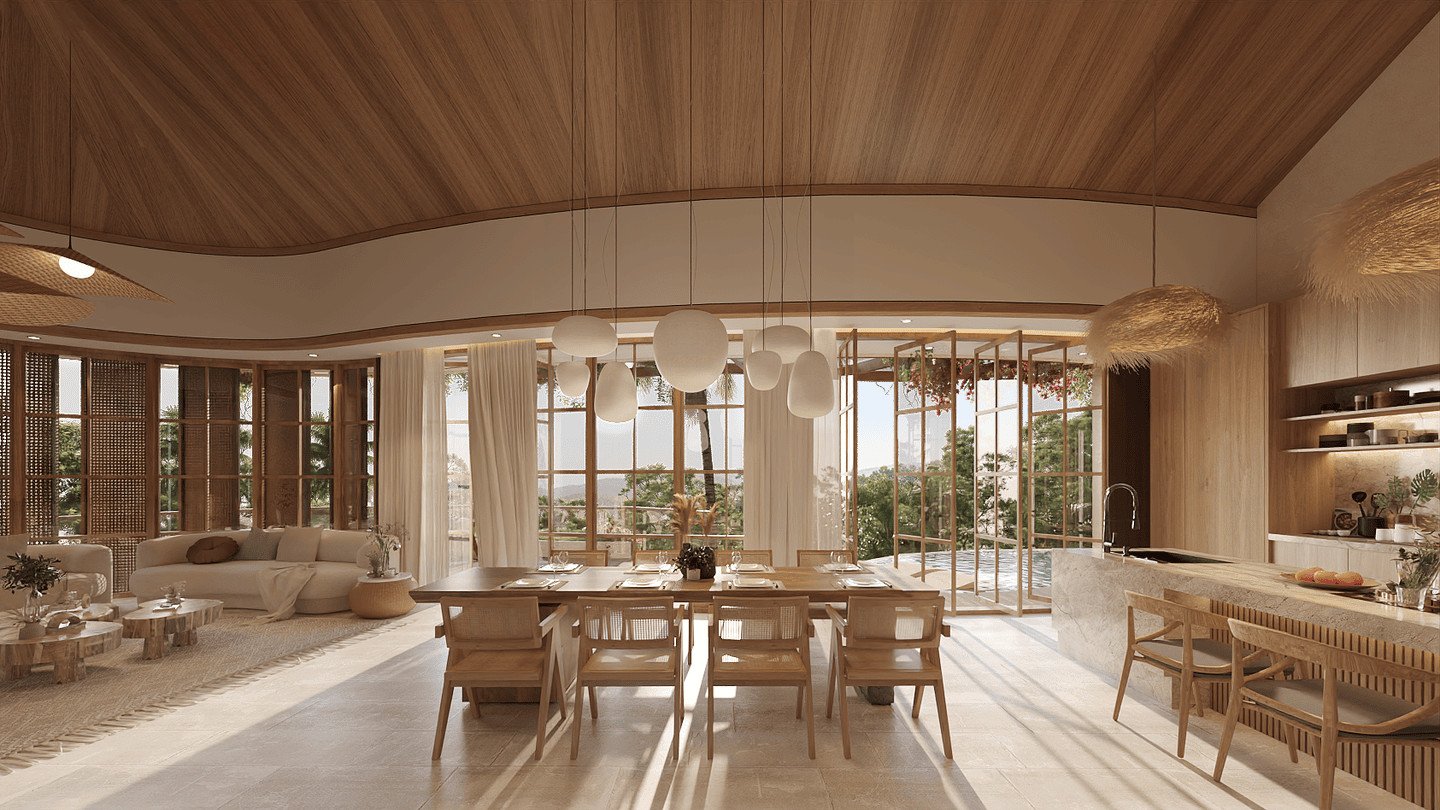
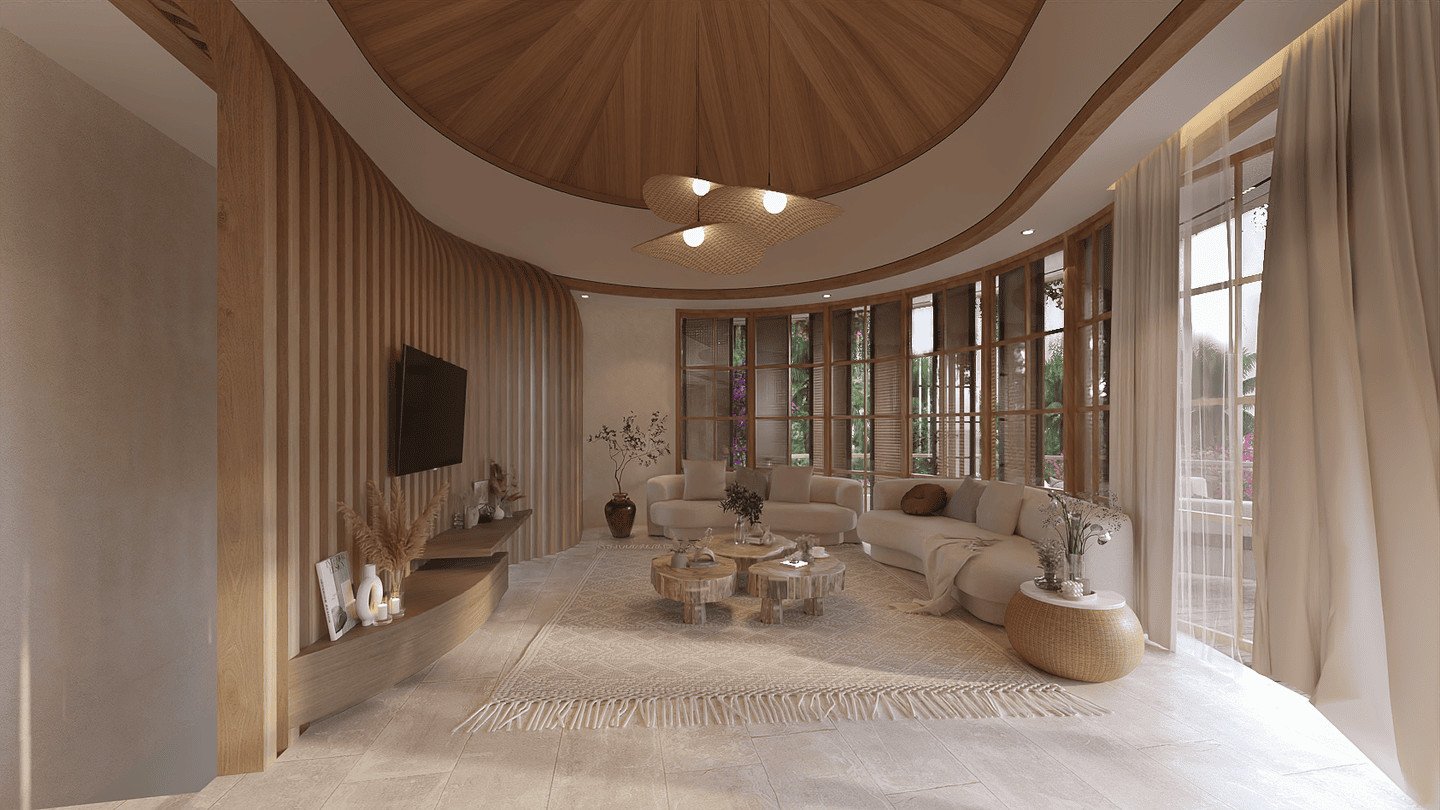
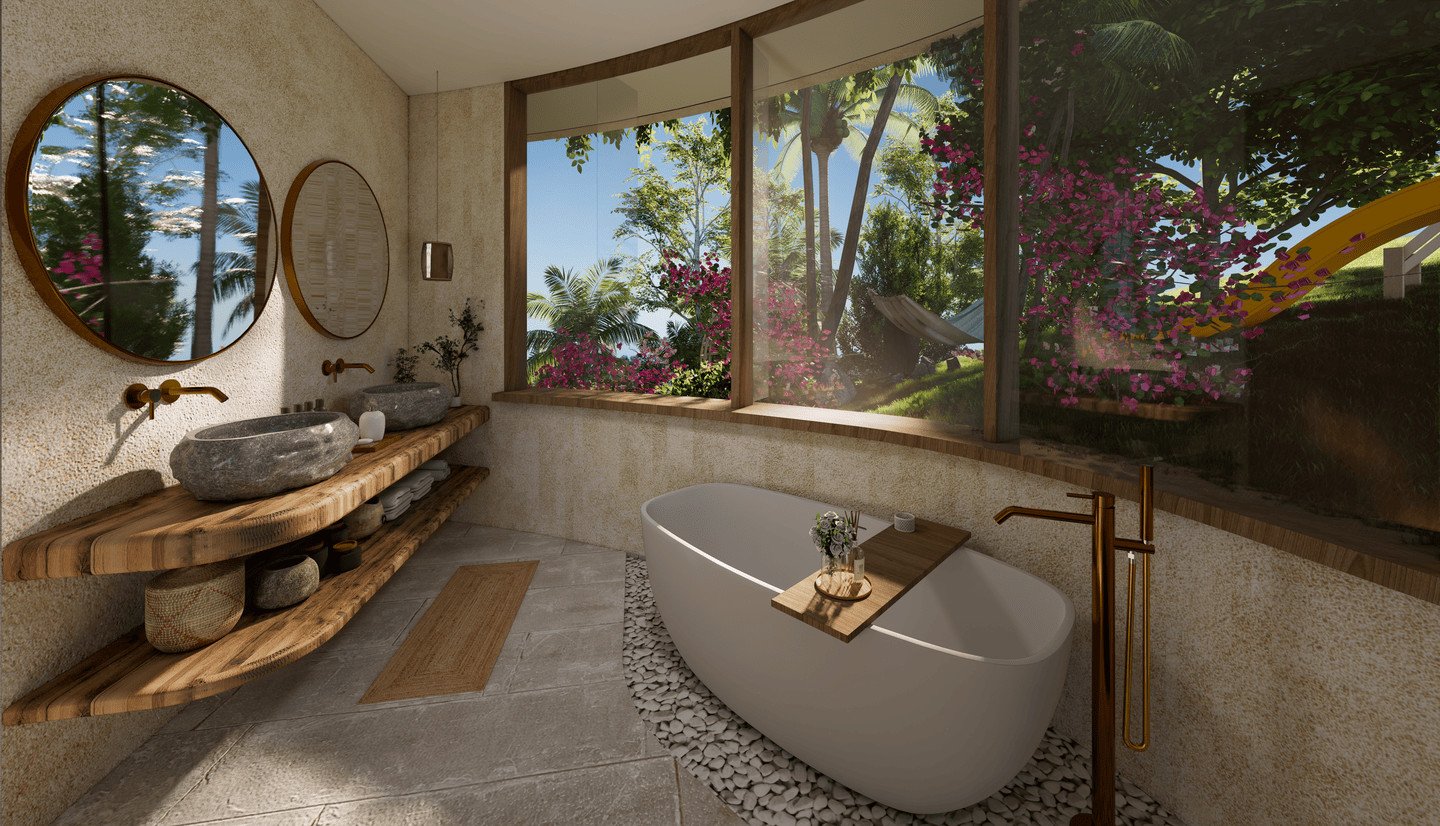
Modern Family Home in Munggu

Modern Family Home in Munggu

Bali, Bali

$263k

Price

4.2%

ROI

3

Bedrooms

53%

Occupancy

2 Bathrooms
Ownership: freehold
Land: 145
Build: 150
Est. Revenue: $16k/yr
Avg Nightly Rate: $84

Investment Analysis

This modern family home is situated in Munggu, seamlessly combines modern living with serene surroundings. Just a short drive from Pererenan area and a leisurely 10-minute stroll to Munggu Beach, it’s also conveniently close to renowned cafes, and restaurants.

Propertia
Bali / Munggu

Modern Family Home in Munggu

Inventory
3 Beds
Bathrooms
2 Baths
Built Area
150 m²
Land Plot
145 m²
Tenure
Freehold
Yield Curve Status

Grade C investment — long-term rental yields 11.6% net return annually.

Go to Source via Propertia

The Investment

Brixfox Score44
GradeC
Brixfox Intelligence
44CModerate
Score Breakdown
ROI & Yield48%
Capital Growth46%
Risk Profile47%
Market Demand44%

The Brixfox Score is our proprietary AI-powered rating that evaluates rental ROI, capital appreciation potential, risk factors, and local market dynamics to give you a single investment quality metric.

Pro members get full score breakdown with AI recommendations
Average annual ROI over 5 years, combining both rental income and property value growth.
Total
+8.5%
Per Year (5yr avg)
Annualized projected property value change based on historical area appreciation rates (5-year average).
Capital Growth
+4.3%
+$57K in 5yr (+22%)
Estimated monthly net income after deducting management fees, operating costs, and taxes.
ROI Nett Rental Income
4.1%
$906/mo
Estimated time for the total investment value (equity + accumulated rent) to double.
100% Profit
11 yr
Combined
Number of years to fully recoup the initial purchase price using only net rental income.
Payback
24.2 yr
Rental only

Income Breakdown

Adjust Forecast

Customize your projections
Nightly Rate (ADR)
$84/night
50% ($42)Brixfox estimate($84/night)200% ($167)
Occupancy
53%
10%Brixfox estimate(53%)100%

Short-Term Rental

Yearly income
$10,876
Airbnb data$84/night · 53% occupancy
Rental income
$84/night · 53% occ.
$16,196
Running costs (20%)
Utilities, cleaning, maintenance
-$3,239
Income tax (10%)
Indonesian rental income tax
-$1,620
Property tax
Annual property tax
-$461
Net income
4.1% ROI
$10,876

Long-Term Rental

Yearly income
$30,426
50 comps
Rental income
$4,450/mo
$42,716
Agency fee (10%)
Finder's fee per tenant
-$4,272
Vacancy (~8%)
1.5mo gap per tenancy
-$3,286
Income tax (10%)
Indonesian rental income tax
-$4,272
Property tax
Annual property tax
-$461
Net income
11.6% ROI
$30,426

Long-term rental earns more with lower risk and less effort.

Growth & Exit Strategy

How your investment grows over time

Freehold — 4%/yr appreciation in Bali.

$1.6M$1.2M$789K$394K$0Yr 0Yr 5Yr 10Yr 15Yr 20Yr 25Yr 30Paid back2x ReturnToday: $263K
Capital appreciation
Property value growing at +4%/yr based on Bali market trends.
Rental income
Cumulative net rental earnings collected over time, growing with annual revenue increases.
Total return
Capital value + rental income. Your actual total position if you sold and kept all rent.
Paid back
Year 19: rental income alone has repaid the full purchase price.
2x return
Year 11: total gains (capital + rental) have doubled your initial investment.
Year 5
Capital Value
$320K
+22%
Rental Income
+$58K
Total Position
$378K
+44%
7.5%/yr
Year 10
Capital Value
$390K
+48%
Rental Income
+$125K
Total Position
$514K
+95%
6.9%/yr
Year 20
Capital Value
$577K
+119%
Rental Income
+$292K
Total Position
$869K
+230%
6.2%/yr
Year 30
Capital Value
$854K
+224%
Rental Income
+$517K
Total Position
$1.4M
+421%
5.7%/yr

Location

Bali

Munggu, Approximate area

Loading Map...

Villa Scorecard

Location
Average
Emerging or secondary location
Rental Yield
Average
4.1% annual return
Occupancy
Average
53% average occupancy
Nightly Rate
Average
$84 per night
Visual Appeal
Average
Not yet analyzed
Size & Space
Weak
145 m² land area
Zoning
Average
STR zoning not confirmed
Tenure
Strong
Freehold ownership

Top Highlights

Freehold ownership — maximum long-term security

Watch Out

Secondary location — rental demand may be lower than premium areas
Yield of 4.1% is near the market average — model your cashflow carefully

Consider carefully. Returns are below market average for this price point.

Risks & What-If

What if occupancy changes?

Owner Managed scenario

33% occ.
2.5%
$550/mo
43% occ.
3.3%
$728/mo
53% occ.
4.1%
$906/mo
current
63% occ.
4.9%
$1,085/mo

Data Sources & Methodology

ROI calculations use verified Brixfox Intelligence rental data from a 12-month trailing window. Opex: 20% owner-managed, 45% fully-managed. Includes 10% Indonesian rental tax (PPh) and annual property tax (PBB). Market factors in Bali may impact actual yields.